H-Index: What It Is and How to Find Yours
by
 To illustrate the value of the H-index, we turn to a classic educational movie…Caddyshack. The uptight and competitive Judge Smails (played by Ted Knight) asks his new competition, Ty Webb (Chevy Chase):
Judge Smails: Ty, what did you shoot today?
Ty Webb: Oh judge, I don’t keep score.
Judge Smails: Then how do you measure yourself with other golfers?
Ty Webb: By height.
As scientists, we’re always looking for new ways to analyze, measure and compare things – including our own performance as scientists.
While most of us would agree that it’s nearly impossible to accurately describe a scientist’s career with a single number, that doesn’t mean metrics that attempt to do so are useless. The h-index, originally described in 2005 by it’s namesake Jorge Hirsch, is a measurement that aims to describe the scientific productivity and impact of a researcher. Like all metrics, the h-index is not perfect; however, it addresses many of the problems associated with impact factors and the publication process in general and enables some very interesting analyses.
Why isn’t impact factor good enough?
Which paper would you consider more significant – a top-tier paper that has been cited 15 times, or a mid-tier paper that’s been cited 500 times? Unfortunately, granting agencies or tenure committees that base their decisions on the journal impact factors support the former. It’s this frustration that has led many to argue that the evolution of scientific impact will move away from this metric over the coming decade.
Journals have long been ranked in order of relative “importance” by their journal impact factor, but that system has come under increasing fire. The importance placed on the journal impact factor, calculated by the average number of citations per article in the previous two years, has led to many journals gaming the system. For example, editors are aware that certain types of articles, such as reviews or techniques, are highly cited and thus will contribute significantly to the journal impact factor. Illustrating the impact just a few highly cited papers can have, Nature reported that 89% of their 2004 impact factor was generated by just 25% of their articles.
What is the H-index?
The index is a measure of the number of highly impactful papers a scientist has published. The larger the number of important papers, the higher the h-index, regardless of where the work was published.
To calculate it, only two pieces of information are required: the total number of papers published (Np) and the number of citations (Nc) for each paper.
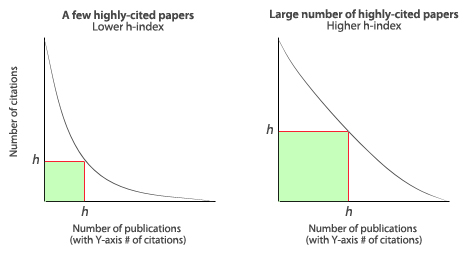
The h-index is defined by how many h of a researcher’s publications (Np) have at least h citations each (see Figure 1).
So we can ask ourselves, “Have I published one paper that’s been cited at least once?” If so, we’ve got an H-index of one and we can move on to the next question, “Have I published two papers that have each been cited at least twice?” If so, our score is 2 and we can continue to repeat this line of questioning until we can’t answer ‘yes’ anymore. Luckily, there’s no need to block off your weekend to try to figure out your stats- the computer’s got you covered (see below).

Figure 1. Variation of the h-index between two researchers with the same number of publications.
.
Why is the H-index an improvement?
The index has several advantages over other metrics:
- It relies on citations to your papers, not the journals, which is a truer measure of quality
- It is not dramatically skewed by a single well-cited, influential paper (unlike total number of citations would be)
- It is not increased by a large number of poorly cited papers (unlike total number of papers would be)
- It minimizes the politics of publication. A high-impact paper counts regardless of whether your competitor kept it from being published in the top-tier journals…
- It’s good for comparing scientists within a field at similar stages in their careers
- It may be used to compare not just individuals, but also departments, programs or any other group of scientists.
What are the weaknesses of the h-index?
Critics of the metric suggest it is limited in the following ways:
- It counts a highly-cited paper regardless of why it’s being referenced- eg, for negative reasons
- It doesn’t account for variations in average number of publications and citations in various fields (some traditionally publish and cite less than others)
- It ignores the number and position of authors on a paper
- It limits authors by the total number of publications, so shorter careers are at a disadvantage
- It has relatively low resolution in that many scientists end up in the same range since it gets increasingly difficult to increase the h-index the higher it gets (an h-index of 100 corresponds to a minimum of 10,000 citations)
- It, like all metrics, is based on data from the past and may not be a valid predictor of future performance. However, in a follow-up publication Jorge Hirsch demonstrated that the h-index is better than other indicators (total papers, total citations, citations per paper) at predicting future scientific achievement.

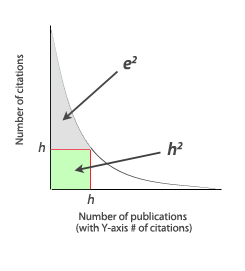
Figure 2. The e-index accounts for the excess citations not included in the h-index.
Are there variations of the h-index?
A few notable modifications are the m- and g- and e-indices. The m-index, introduced by the creator of the h-index, is defined as the h-index divided by the number of years since the researcher’s first publication. The index is meant to normalize the h-index so that early- and late-stage scientists can be compared. The m-index averages periods of high and low productivity throughout a career, which may or may not be reflective of the current situation of the scientist.
The h-index is relatively unaffected by a small number of exceptionally well-cited articles (eg, reviews). But the case can be made that researchers who have published a landmark paper should get the proper credit for it. The g-index was developed for this reason. Like the h-index, when a researcher’s publications are listed in decreasing order of citations received, the g-index is the largest number such that the top g articles received, in total, at least g2 citations. Therefore, a few well-cited papers can significantly increase the g-index relative to the corresponding h-index.
Like the g-index, the e-index aims to address the number of “excess” citations above and beyond the h-index (see Figure 2). The e-index is defined as the square root of the sum of the “excess” citations in the papers that contributed to the h-index.
How do I find my H-index?
If you have access to the ISI Web of Knowledge, your index is just a few clicks away. See the short video below for step-by-step instructions on where to find the value and what settings to consider.
.
.
Alternatively, you can manually calculate it using Google Scholar or use this Firefox ad-on to make it easier.
So give it a shot and see how you measure up against other scientists. Of course, if it’s too much of a hassle we can always take Ty Webb’s advice and go back to using height.
.
References
Hirsch, J. E. (15 November 2005). “An index to quantify an individual’s scientific research output”. PNAS 102 (46): 16569–16572.
Hirsch J. E. (2007). “Does the h-index have predictive power?”. PNAS 104 (49): 19193–19198.
“Not-so-deep impact“. Nature 435 (7045): 1003–4. 2005.
Egghe, Leo (2006) Theory and practise of the g-index, Scientometrics, vol. 69, No 1, pp. 131–152
Zhang C-T (2009) The e-Index, Complementing the h-Index for Excess Citations. PLoS ONE 4(5): e5429.
.
What do you think of the h-index?
.
.


whizkid
wrote on October 21, 2010 at 9:10 am
The beauty of the h index is in it's simplicity. Yes, there are subsequent modifications that attempt to improve upon it's weaknesses, but in my opinion the improvements don't amount to much more than splitting hairs.
Career-related from Grad School to Job | BenchFly Blog
wrote on December 2, 2010 at 4:54 pm
[…] H-index: What it is and How to Find Yours – an emerging metric, the h-index provides researchers with a potentially improved measure of scientific impact […]
vacanzecalabria
wrote on August 22, 2011 at 3:25 pm
Hello, I wanted to tell you about an plugin to calculate the h-index using Firefox with Google Scholar: https://addons.mozilla.org/en-US/firefox/addon/sc…
David
wrote on June 27, 2012 at 2:11 am
Very clearly explained. The most lucid that I have seen.
Steven
wrote on October 20, 2012 at 4:21 pm
H index is a nice measure, but I'm not too fond of it. Cestagi's c-index in my opinion captures your overall career growth much better. And is much more accurate in a lot of cases, since it's based on your input.
Sone
wrote on May 9, 2013 at 12:08 pm
The video and the description were very helpful and simplistic. Thank you!
Rupert Witherow
wrote on October 30, 2013 at 9:02 am
Good explanation of a neat idea. It appears from the description that the index is inherently biased in favour of continuous output and therefore incremental / evolutionary work – which clearly is perfect for current funding models. Discontinuous work with a single magnum opus, however profound and constructive is rated akin to any decent researcher's first acclaimed paper. It strikes me that most of the giants on whose shoulders we stand today would fare very poorly by this measure. Is that what we want to perpetuate?